APAC CIOOutlook

Advertise

with us

  • Technologies
      • Artificial Intelligence
      • Big Data
      • Blockchain
      • Cloud
      • Digital Transformation
      • Internet of Things
      • Low Code No Code
      • MarTech
      • Mobile Application
      • Security
      • Software Testing
      • Wireless
  • Industries
      • E-Commerce
      • Education
      • Logistics
      • Retail
      • Supply Chain
      • Travel and Hospitality
  • Platforms
      • Microsoft
      • Salesforce
      • SAP
  • Solutions
      • Business Intelligence
      • Cognitive
      • Contact Center
      • CRM
      • Cyber Security
      • Data Center
      • Gamification
      • Procurement
      • Smart City
      • Workflow
  • Home
  • CXO Insights
  • CIO Views
  • Vendors
  • News
  • Conferences
  • Whitepapers
  • Newsletter
  • Awards
Apac
  • Artificial Intelligence

    Big Data

    Blockchain

    Cloud

    Digital Transformation

    Internet of Things

    Low Code No Code

    MarTech

    Mobile Application

    Security

    Software Testing

    Wireless

  • E-Commerce

    Education

    Logistics

    Retail

    Supply Chain

    Travel and Hospitality

  • Microsoft

    Salesforce

    SAP

  • Business Intelligence

    Cognitive

    Contact Center

    CRM

    Cyber Security

    Data Center

    Gamification

    Procurement

    Smart City

    Workflow

Menu
    • Cyber Security
    • Hotel Management
    • Workflow
    • E-Commerce
    • Business Intelligence
    • MORE
    #

    Apac CIOOutlook Weekly Brief

    ×

    Be first to read the latest tech news, Industry Leader's Insights, and CIO interviews of medium and large enterprises exclusively from Apac CIOOutlook

    Subscribe

    loading

    THANK YOU FOR SUBSCRIBING

    Need for Learning Data Visualization

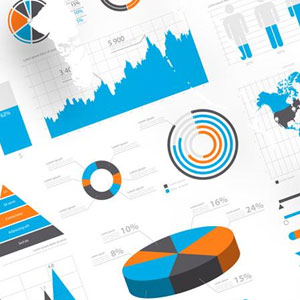
    Data visualization in simple terms is a computerized version of visual communication.  
    Need for Learning Data Visualization

    By

    Apac CIOOutlook | Monday, January 08, 2018

    Stay ahead of the industry with exclusive feature stories on the top companies, expert insights and the latest news delivered straight to your inbox. Subscribe today.

    Data visualization in simple terms is a computerized version of visual communication. It is a way of ensuring a person who does not have a very sound knowledge of technology understands what data is, and more so, understanding terms such as Big Data. Pictorial representation of data with an objective to provide a better understanding is what data visualization is about. Non-technical people can grasp and analyze links and patterns better with a graphical option. Now visualization tools, historical forms of data visualization and graphs that were once catered by MS Excel and PowerPoint have witnessed a major jump.


    There are numerous data visualization tools that businesses can choose from. Having data visualization tools is an essential part of business intelligence, and it's important to be inculcated in it. An ever-increasing number of firms are digging into it and are thriving. Going past the customary and standard types of visualizing the data, these visualization tools have moved towards becoming most widely used language for business intelligence.

    Graphics have another critical part in visualizing data both statistically and informatively. Accessibility of data is relative to how simple it is to comprehend. Graphics that are utilized for data visualization ensures there is space for modulation and comparison. Living in an age where technology is flourishing day by day, and technology such as AI, IoT, and Big Data becoming the core, data visualization becomes a reason for its further growth.
    Tableau, a data visualization technique doesn't require the skills of a programmer yet doesn't completely do away with it. And being the most well known and popular platform for data visualization, Tableau has become a significant part of the business analysis and process requirements.


    Be it for description, analysis or prediction, data visualization is pivotal in understanding data.

    Check This Out: Top Data Visualization Companies

    More in News

    The Journey Towards Smart City Development

    The Journey Towards Smart City Development

    Harnessing Big Data Analytics to Enhance Business Strategies

    Harnessing Big Data Analytics to Enhance Business Strategies

    AI's Role in Apac's Digital Transformation Journey

    AI's Role in Apac's Digital Transformation Journey

    Impact of Digital Transformation on Retail

    Impact of Digital Transformation on Retail

    I agree We use cookies on this website to enhance your user experience. By clicking any link on this page you are giving your consent for us to set cookies. More info

    Copyright © 2025 APAC CIOOutlook. All rights reserved. Registration on or use of this site constitutes acceptance of our Terms of Use and Privacy and Anti Spam Policy 

    Home |  CXO Insights |   Whitepapers |   Subscribe |   Conferences |   Sitemaps |   About us |   Advertise with us |   Editorial Policy |   Feedback Policy |  

    follow on linkedinfollow on twitter follow on rss
    This content is copyright protected

    However, if you would like to share the information in this article, you may use the link below:

    https://www.apacciooutlook.com/news/need-for-learning-data-visualization--nwid-4790.html